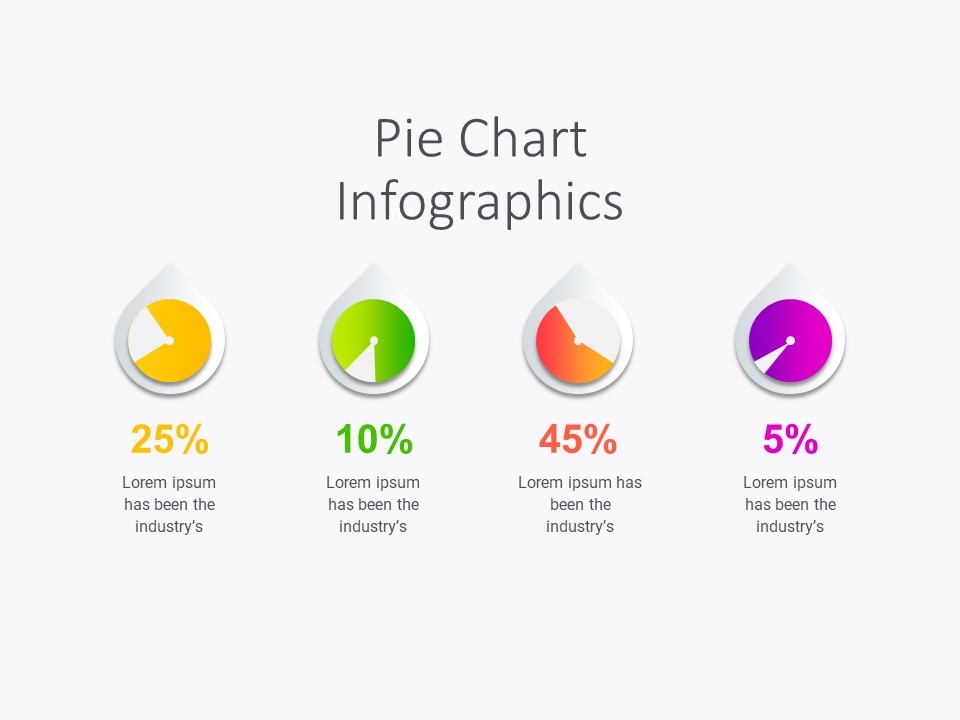
Pie Chart Infographics 03
Product Description
A project’s progress in relation to the project plan is shown in the PMO Project Status Dashboard, a single document. Project managers can use this project status dashboard to discuss the development of a specific project they are working on. Use this dashboard to display information about your projects, such as how many tasks are on track and how many are not, how long it will take to finish each project, and how much work is still left to do on each task. This project status dashboard includes aesthetically pleasing infographics, such as bar graphs and pie charts, to present complex facts to your audience in a clear and understandable way. For a larger selection of project-related presentations, you can also check out our Project Management Office Templates.


