Visual Data Power Point Presentation Template


 (No Ratings Yet)
![]() Loading...
Loading...
Product Description
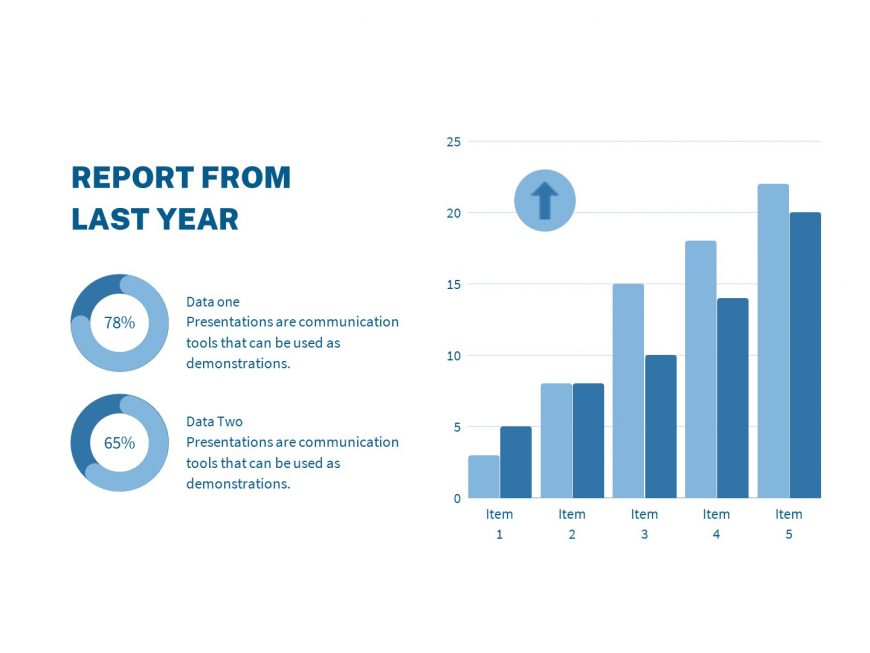
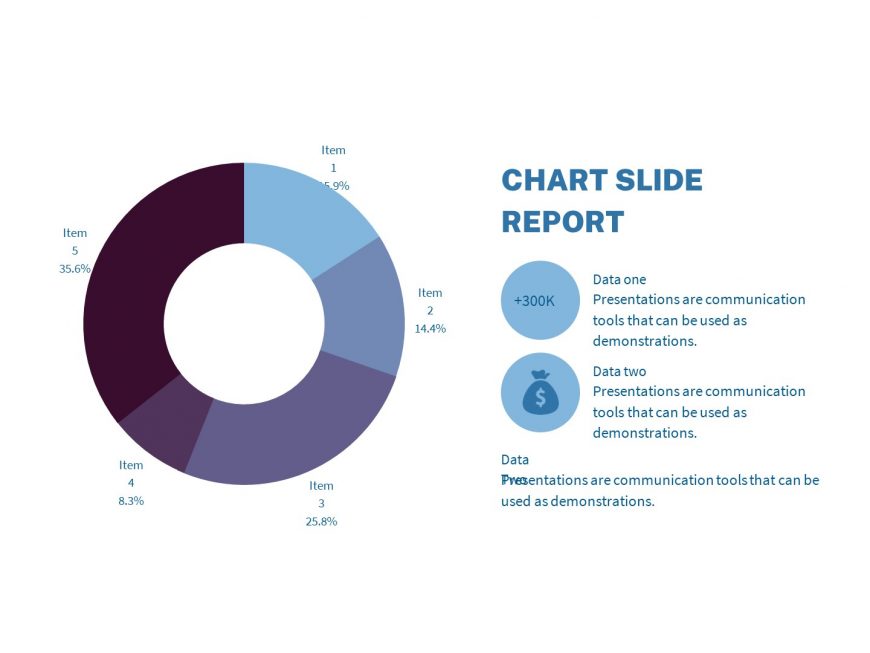
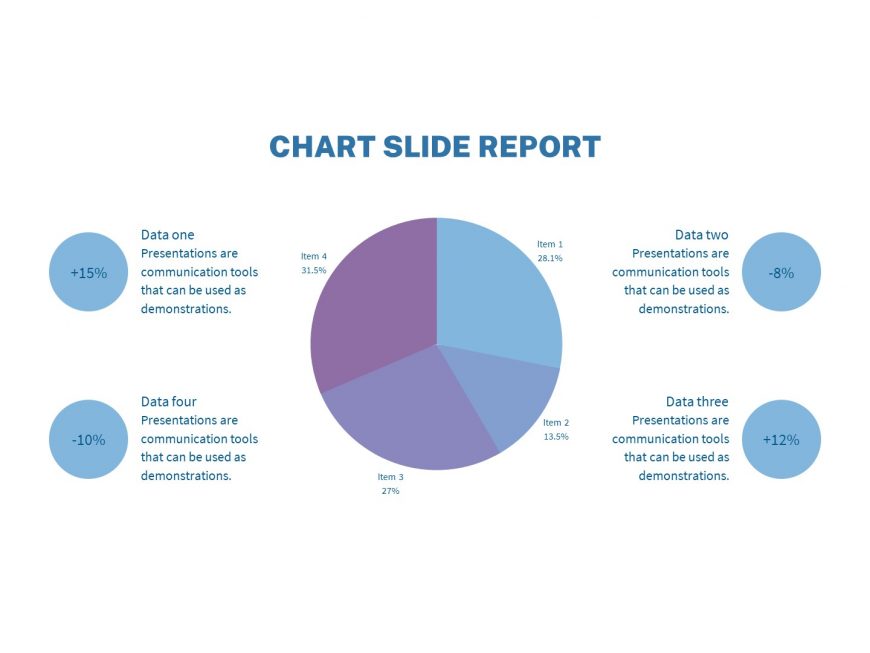
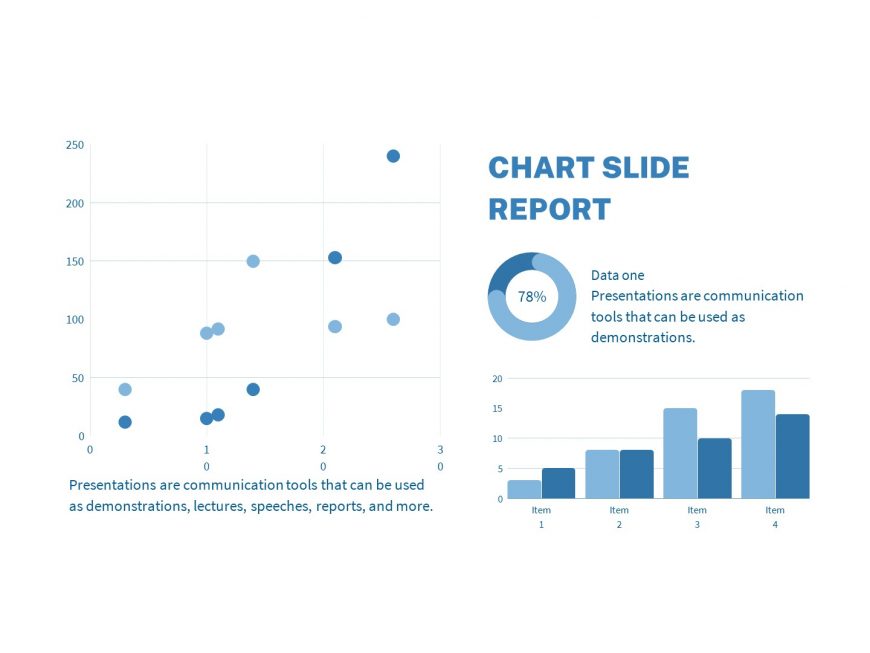
The S-curve graph presentation is part of the Visual & Data Chart Template for PowerPoint. One S-curve each for projected value, earned value, and actual cost are displayed. The graph’s x-axis depicts time, while the y-axis costs. For finance and budgetary meetings, the project managers use a graph template for earned value management. It aids viewers in visualising a project’s time and cost performance. Two slides with a black and white background each are included in this Earned Value Management chart design. Users can select a layout that goes with the concept of their project presentation. Additionally, the EVM template offers pre-defined settings for measuring values. These include schedule variance, expense variance, time behind, and time now. As an alternative, you can download additional editable PowerPoint diagrams and presentation templates that are compatible with